Last Updated:
22nd July 2009
It had been about three years since our last Visitor Feedback survey, and at first we weren’t sure about doing a third. After all, the second had mainly returned much of the same results as the first. However, after a bit of discussion, we came up with some different questions. So, hopefully, there will be a few surprises.
Thanks to everyone who participated.
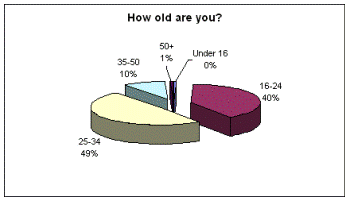
| Age: This first question did not change from the previous two feedbacks. Interestingly, it looks like our audience has aged a little bit. This time there was only a single reader under 16 (rounded down in the chart), with 16 to 24 having declined from 61% in 2004 to 59% in 2006, to now only 40% in 2009. We did change the 25 to 30 category to 25 to 34, so that might be part of the reason why it went from 19% to 26% to a whopping 49%! The change in the rest of the categories makes comparison invalid, but it’s interesting that only 11% of visitors are over 35. |
 |
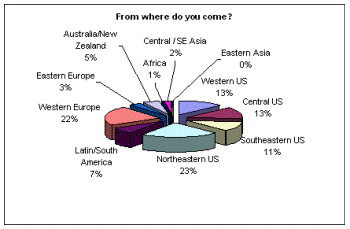
| Location: In the previous two surveys, we had asked visitors from where they came, but had foolishly limited it to continents, rather than more specific locations. I will admit that when coming up with the locations… I forgot Canada. I know, a quintessentially American snub, but unintentional. Honestly, we kind of forget you’re up there. Though a plea went out for Canadians to fix this, fewer replied back than those who pointed out the error in the poll, so this chart will have to remain flawed. |
 |
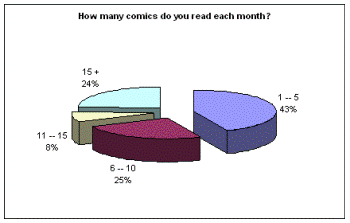
| How many comics per month: With a little deviation, the response for this seems to be exactly what we received the last time. |
 |
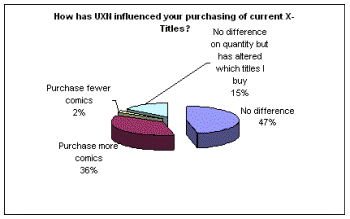
| Influenced current: Another tweaked question, this one trying to determine if the UXN has influenced people’s buying habits for new books. Almost half stated not at all, but over a third said that it increased. Luckily for our relationship with Marvel, this far overshadows the 2% who purchase fewer. |
 |
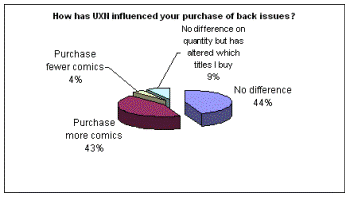
| Influenced back issues: In previous surveys, people had stated that one of the ways in which they use the UXN was to look up when events happened in the books, so that they could seek out the issue to read. This question was to determine what percentage of people did this. For the most part, the numbers look similar to the influence of current titles, but a few more seem to seek out those older issues. |
 |
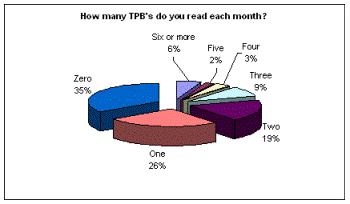
| How many TPBs per month: A new question, one made to give perspective on the next question, of the site’s influence on people purchasing TPBs. |
 |
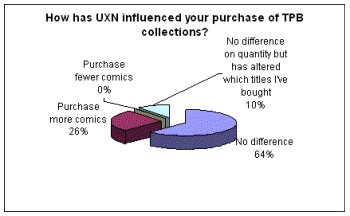
| Influenced TPBs: Much like the other two, this new question was to determine the site’s affect on the Trade Paperbacks (not *ahem* “trades”). With the growing market of TPBs (and how quite a few people purchase solely these, as opposed to the issues), I was surprised that this was not more. However… that’s why surveys exist. |
 |
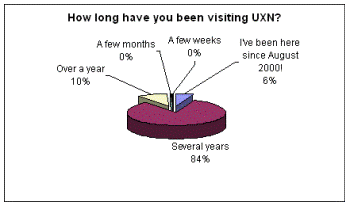
| How long visited the UXN: This question was new, with us trying to figure out how long visitors had been visiting the site. Rather shockingly, all of our visitors have been with the site for more than a year, with 84% for multiple years at least. |
 |
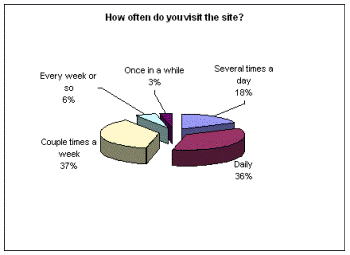
| How often visit site: Here was a question that was in our first, but not our second survey. Like the one 5 years ago, it seems that the vast majority visit the site once a week. In fact, over 50% visit it every day! The 9% who do so every “week or so” or “once in awhile” need to get their priorities in order… |
 |
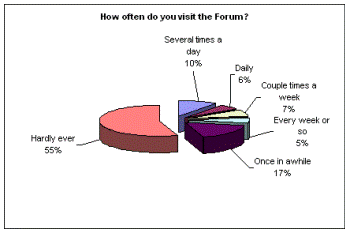
| How often visit forum: This was a tweaked question asked only in the 2006 survey. Over half of the visitors of the site hardly ever visit the forum. This is perfectly fine, considering that there are so many comic-related forums out there. However, it is something to consider that over half the people who read our articles & summaries do not have a means to provide any feedback. |
 |
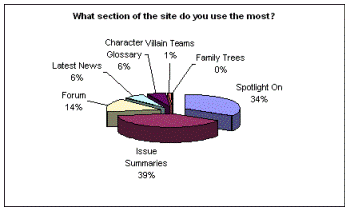
| Favorite feature: This question has been asked each time, with an interesting trend. Our two favorite sections continue to be the Spotlight On… and Issue Summary sections. Fascinatingly, the Spotlight/Summary ratio has been progressing toward the Summaries, going from 51.7% / 16.5% in 2004, to 37% / 22% in 2006 – now to 39% / 34%. Part of this might be that in those five years our Issue Summary database has gotten much more comprehensive. |
 |
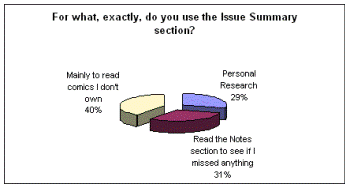
| Reason for summary: The response in the previous survey interested us in what people had been saying about their use of Issue Summaries. So, we asked. Nearly a third visited them just to read the Notes, similar to reading trivia about an episode in a TV episode guide. Almost as many just used to research (perhaps to influence their buying habits, or see what went on in issues they didn’t buy). A whopping 40% read the whole summary, treating them like a novelization of a movie. That certainly makes it worth all of the time and effort of translating the drawn panel to a written paragraph. |
 |
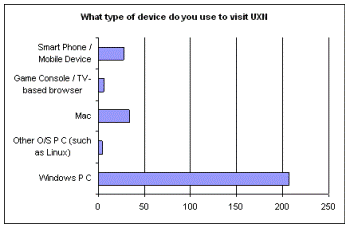
| What type of computer? As we have seen from those Mac/PC commercials, which seem to pivot between humorous and obnoxious, there is a pull and tug between the different systems. On a lark, we asked what type of system you use – and the vast majority use PCs, with “mobile device” almost equaling that of the Mac. |
 |
